Datalogix
Datalogix
Oracle Advertising, formerly Datalogix, is a cloud-based consumer data collection, activation, and measurement platform for use by digital advertisers. Datalogix was a consumer data collection company based in Westminster, Colorado that provided offline consumer spending data to marketers. In December 2014, Oracle signed an agreement to acquire Datalogix. After the acquisition, Datalogix’s name changed to Oracle Data Cloud, which later became Oracle Advertising. Oracle Advertising is part of the Oracle Advertising and Customer Experience (CX) application suite.
This collected data, which include purchase data from stores, credit cards, and loyalty cards, helps marketing teams determine their ad campaigns’ effectiveness and those that will potentially increase profits, with Datalogix clients including retail stores, grocers, travel agencies, PepsiCo, Ford, and the Dr. Pepper Snapple Group. After consumer spending behaviors are measured, the information is sold to advertising companies and publishers, such as Facebook, Google, Twitter, Snapchat, and Pinterest. Advertisers then use the information obtained to tailor online ads and reach new or existing customers. In turn, publishers use the data to determine the amount of profit advertisers earned and to convince them to purchase more ads that will feature on their websites. Advertisers and publishers have used Datalogix to help increase profits, as the use of digital media continues to expand.
In 2017, Oracle also acquired Moat, an ad measurement company, which also became part of Oracle Data Cloud, now Oracle Advertising. The Moat acquisition added measurement and analytics capabilities to allow advertisers to track and measure media, as well as the performance of interactions with online ads.
BlueKai, acquired by Oracle in 2014, is a cloud-based data collection platform that uses website cookies to collect online tracking data. The tracking data is then used by marketers to target users with ads specific to their interests, behavior patterns, or demographics. BlueKai is part of Oracle Marketing.
Oracle Data Cloud (Datalogix) dashboards
From Audience Insight, you can now view the following: Oracle Data Cloud (Datalogix) dashboards:
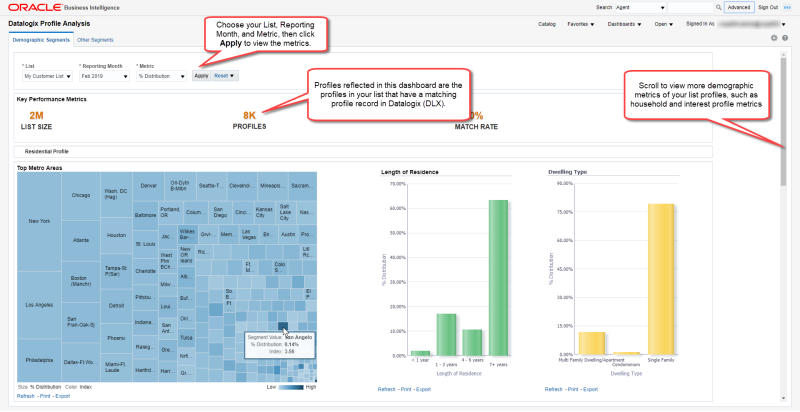
- The Datalogix Profile Analysis dashboard shows the distribution of your profile list by the Datalogix catagories and compares that to the Datalogix baseline. This provides visibility on your match rate and a better understanding of your audience profile, for example, the metro areas of your audience. The dashboards also show your distribution of profiles across demographic, lifestyle, retail behavioral, and purchase behavioral segments, based on attributes from Datalogix. This analysis can tell you more about the audience, such as whether you see more “Sports Fans” on your profile than “Gadget Geeks.”
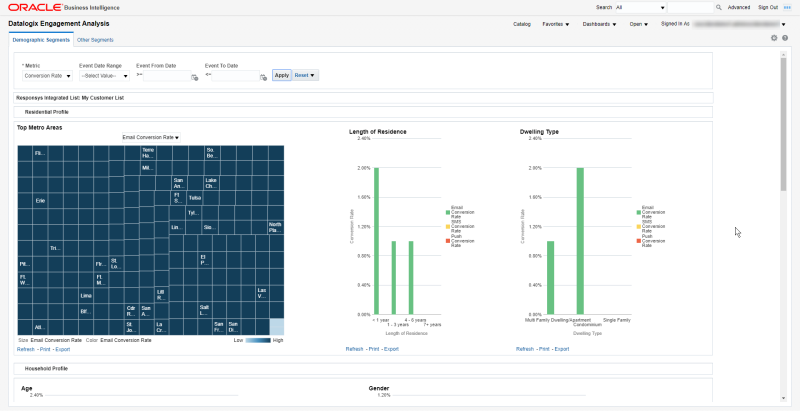
- The Datalogix Engagement Analysis dashboard shows behavioral metrics (such as Conversion Rate) of your profile list by segments defined by Datalogix categories. For example, it can tell you the conversion rate by length of residence, dwelling type, household profile attributes, interests, and the like.
Important: This feature is only available if your account has purchased and enabled the Oracle CX Audience – Data Cloud Integration.
Using the Datalogix Profile Analysis dashboard
To access the Datalogix Profile Analysis dashboard:
- From the navigation menu, select Audience Insight, and then select Datalogix Dashboards.
The Datalogix Profile Analysis dashboard opens in a new web browser window. On open, the dashboard shows the Demographic Segments. Click the Other Segments tab to view Lifestyle Segments, Retail Behavioral Segments, and Purchase Behavioral Segments.
- Choose your list and the reporting month for which you want to view reporting data.
- Optionally, you can change the metric to one of the values described below. Metrics are shown for the selected list.
- Profiles: Count of profiles that have a matching profile record in the Datalogix baseline for the given Datalogix segment. For example, when you move your mouse cursor over the Females segment of the Gender category chart, if you see “Profiles: 3,356”, that is the number of your list profiles that have a matching Datalogix profile and that fall into the “Females” segment.
- % Distribution: % distribution Datalogix category of the profiles. For example, if you see a value of 25% for Females in the Gender chart, this means that for your list profiles that have a matching Datalogix profile, 25% fall into the “Females” category. Note that not all profiles will have a value for every category. For example, out of 500,000 matched profiles, only 400,000 might have a value for gender. In that case, the % Distribution will exclude the 100,000 profiles who do not have a value for gender. This provides a more reasonable comparison of the values in the category, based on known information.
- Index: Calculated by dividing the percentage of your list in a category by the percentage for the category on the Datalogix baseline. A value above 1 indicates an over-indexing characteristic.
- Click Apply to refresh the charts.
How CX Audience calculates data for the Reporting Month
The reporting month represents the month for which CX Audience generates the profile counts. If you scroll to the bottom of the page, you can see the last Profile Refresh Date and the last Datalogix Baseline Refresh Date. (Date and time are shown in the account’s time zone.)
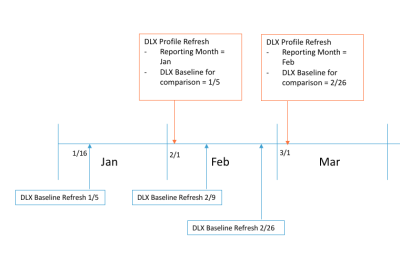
CX Audience generates the profile counts on the first of every month, for the previous month. For example:
- The profile counts for January 2019 are generated on 1st February 2019.
- On 1st February 2019, the reporting month displays Jan 2019.
- On 1st March 2019, the reporting month will display Feb 2019, and so on.
For the index calculation, CX Audience uses the latest available Datalogix baseline when it runs the profile counts. For example, if Datalogix baseline refreshes happen on February 9 and February 26, CX Audience uses the February 26 when it runs the profile counts on March 1.
The image below illustrates the examples described above.
Using the Datalogix Engagement Analysis dashboard
To access the Datalogix Engagement Analysis dashboard:
- From the navigation menu, select Audience Insight, and then select Datalogix Dashboards.The Datalogix Profile Analysis dashboard opens in a new web browser window.
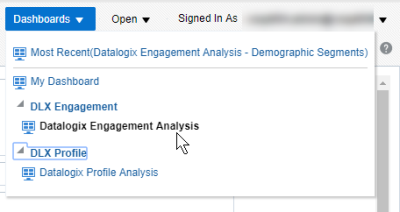
- Click Dashboards, then click Datalogix Engagement Analysis.

The Datalogix Engagement Analysis dashboard is displayed. From this dashboard, you can change the metric and the date range for the events, and then click Apply to refresh the charts.
Note: The Datalogix Engagement Analysis dashboard is only available for your Responsys-integrated list.
Viewing metrics
For your profiles matching Datalogix profiles for a given segment, you can view the following metrics (Learn more about measures for the specific channels). To change the metric, select a new one from the list and then click Apply.
- Conversion Rate: (Campaign Message Conversions/ Messages Delivered) * 100% (Not applicable for In-app campaigns)
- Click-Through Rate: (Campaign Message Clicks/Messages Delivered) * 100%
- Delivered Rate: (Campaign Messages Delivered/Messages Sent)*100 %
- Open Rate: (Campaign Message Opens/Messages Delivered) * 100% (Not applicable for SMS campaigns)
- Average Order Value: (Total Campaign Launch Revenue/Campaign Message Conversions) (Not applicable for Push or In-app campaigns)
- Revenue Per 1K Messages: (Total Email Launch Revenue/Email Messages Delivered) * 1000
Using the event date controls
Use the event date controls to show event data for a particular time range. You can query up to 2 years of behavioral data.
- Select an Event Date Range to view rolling time windows, such as “Last 3 Months” or “Last Quarter”. Tips for using Event Date Range:
- Date range values are calculated by the account’s time zone.
- “Last” date ranges always exclude the current date, week, month, or quarter, depending on the date range selected.
- “Last Quarter” follows the calendar year (for example, Q1 is January, February, March).
- Use the Event From Date and Event To Date to define a specific date range. For example, if you wanted to view an interval between August 1, 2019 and September 30, 2019, you would set Event From Date to 08/01/2019 and Event To Date to 09/30/2019.
Event attribution to Datalogix categories
Events refer to opens, clicks, conversions, and the like. Events are attributed to the Datalogix category of the recipient at the time the event occurred.
Pros
-
API access through internet.
-
Free up resources to focus on more strategic initiatives.
-
High availability and security.
-
Customers with access to a database without having to deploy.
Cons
-
Prices and plans are higher not for mid level companies.
-
Not supported to all programming languages.
-
Need to go with more detail in user interface.
-
Provide more support to customers.


